


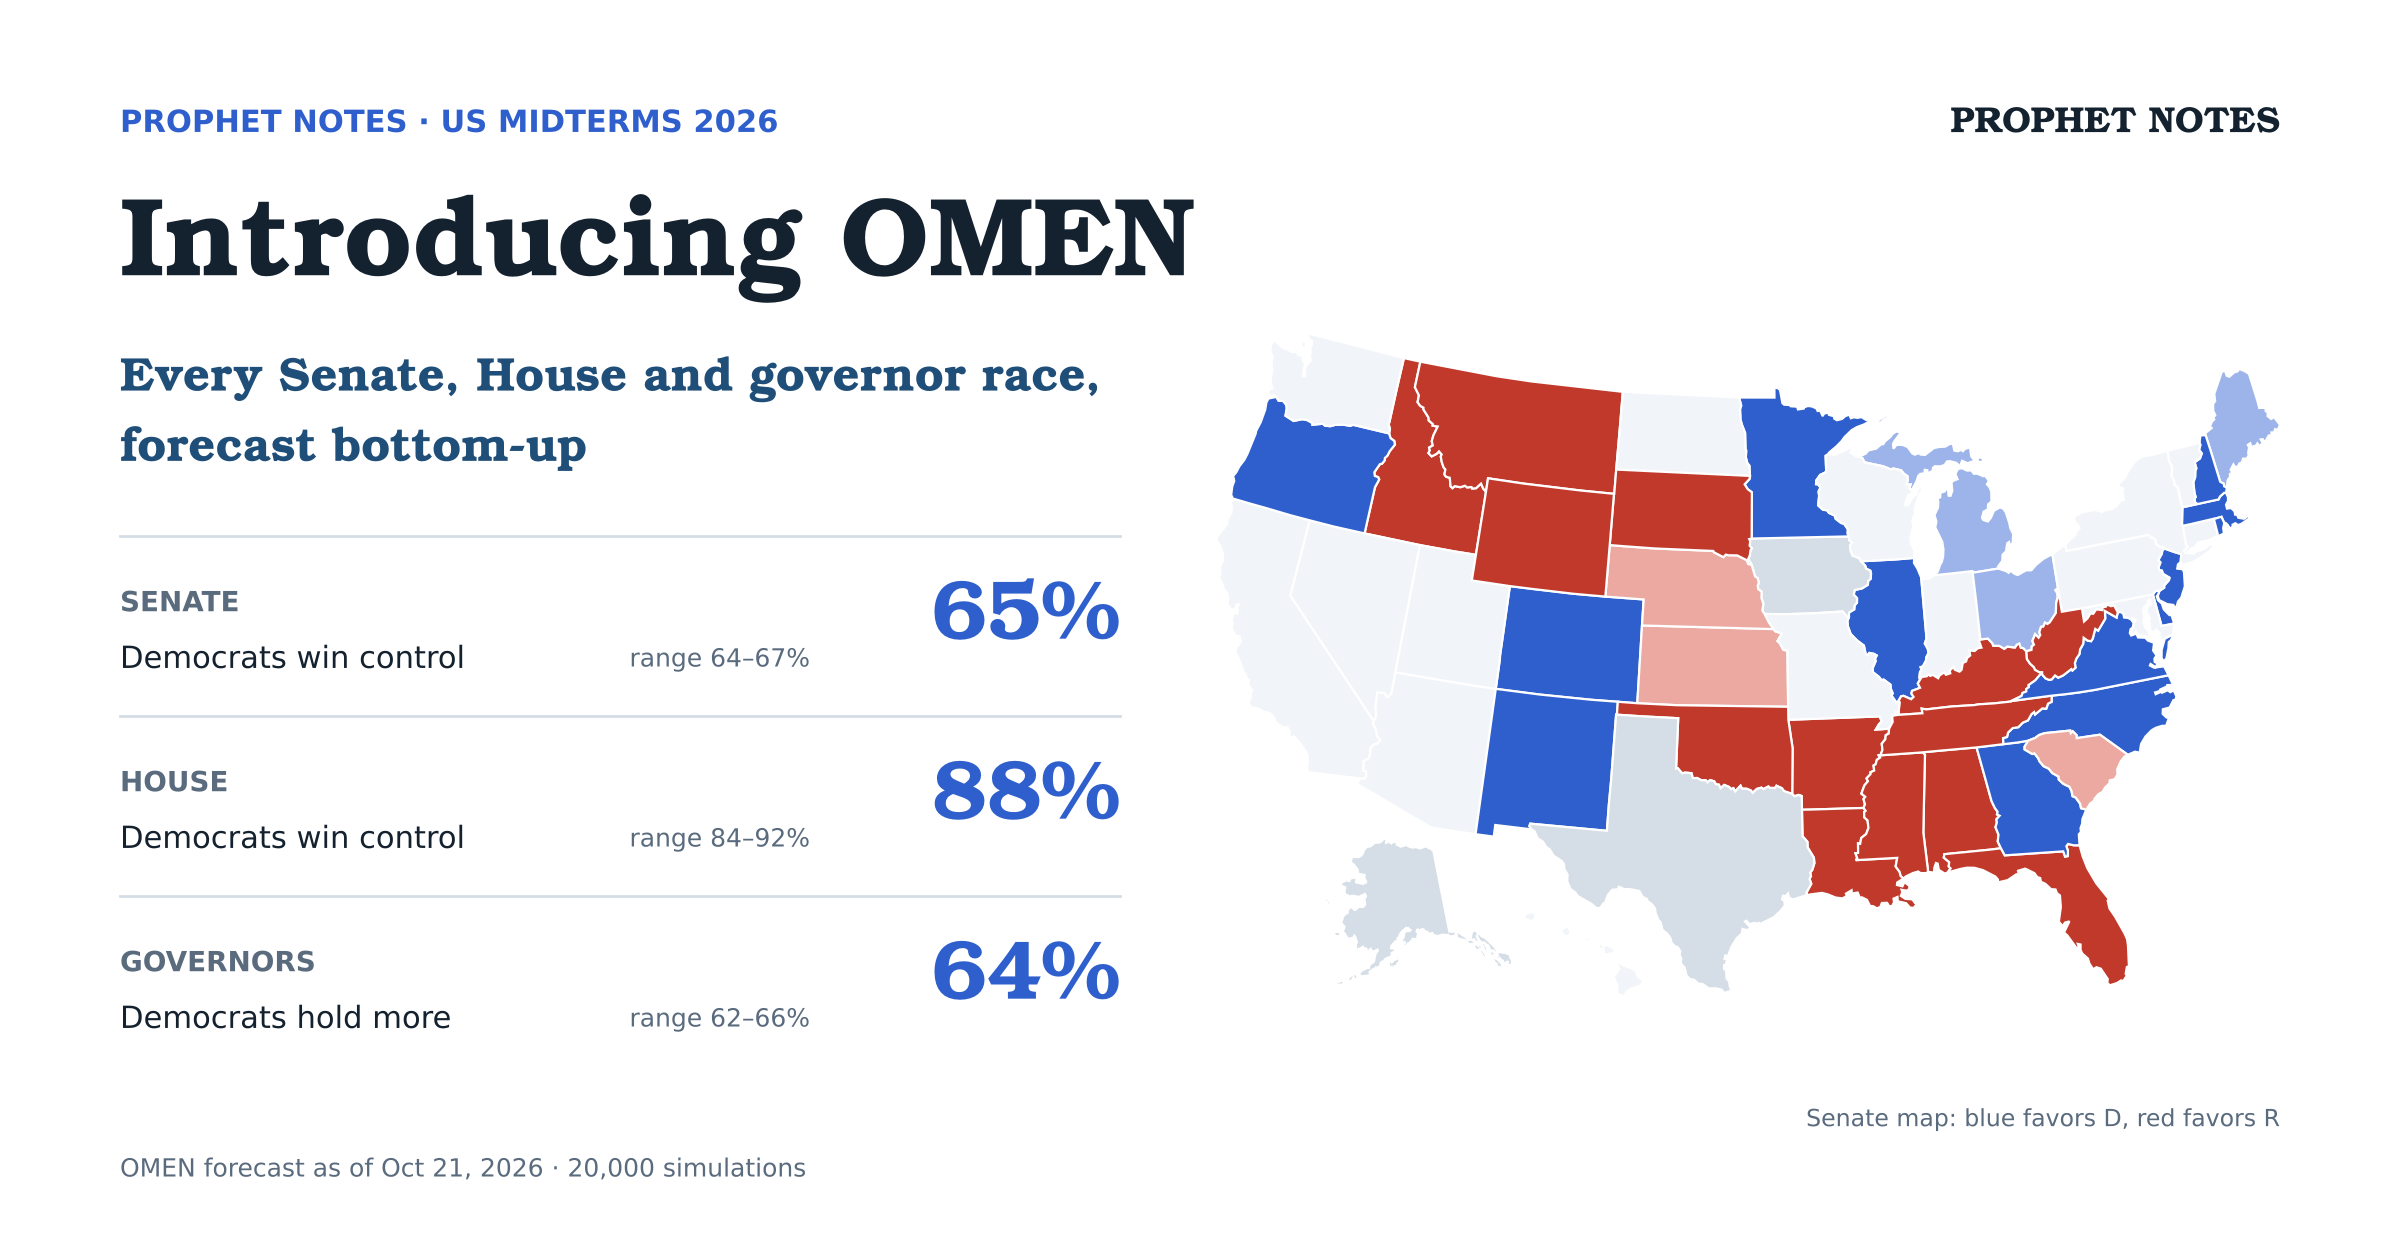
Creating a model of US elections is a nightmare, you know? In these midterms alone, we have 506 individual races. Apart from the governor races, they all add up to Senate and House control. There are two ways to model it: you can go the easy way and do it top down, meaning extrapolating national data to seat allocation, or you can do it the hard way and model every single race bottom-up.
There are, of course, different pros and cons depending on the approach. The easy way gets you 80% there—you have a number, but it’s a ballpark figure with no option to trade individual races. And you can build it with little modeling experience.
For me, easy paths are boring, so I took the hard one. OMEN (Odds and Margins for Every Nominee) looks at every race and builds Senate, House and governor forecasts bottom-up. Thanks to that, every race has its own forecast, and the toplines are built from them. The drawback is time—it took me weeks of work to set up the model and then fine-tune it to actually work. Without Claude Code, it would probably have taken me a year.
Ultimately, the model ended up close to the market and other public forecasts. It’s no shocker. After all, US elections are the most traded elections in the world, and plenty of traders run their own models. This is exactly the reason I built it bottom-up—while the topline diff is minimal, there are several races where my forecast diverges from the market.
Before we dive into specific races, a few words on the toplines.
OMEN
OMEN is a proper election model. Each forecast starts from a prior built on fundamentals, and polls then update it. The model is fitted on past races and tested on other past elections it was not fitted on.
All probabilities come from 20,000 Monte Carlo draws. For every race and every aggregate market, OMEN gives a probability with its range, and a vote share with its p10–p90 band.
Senate
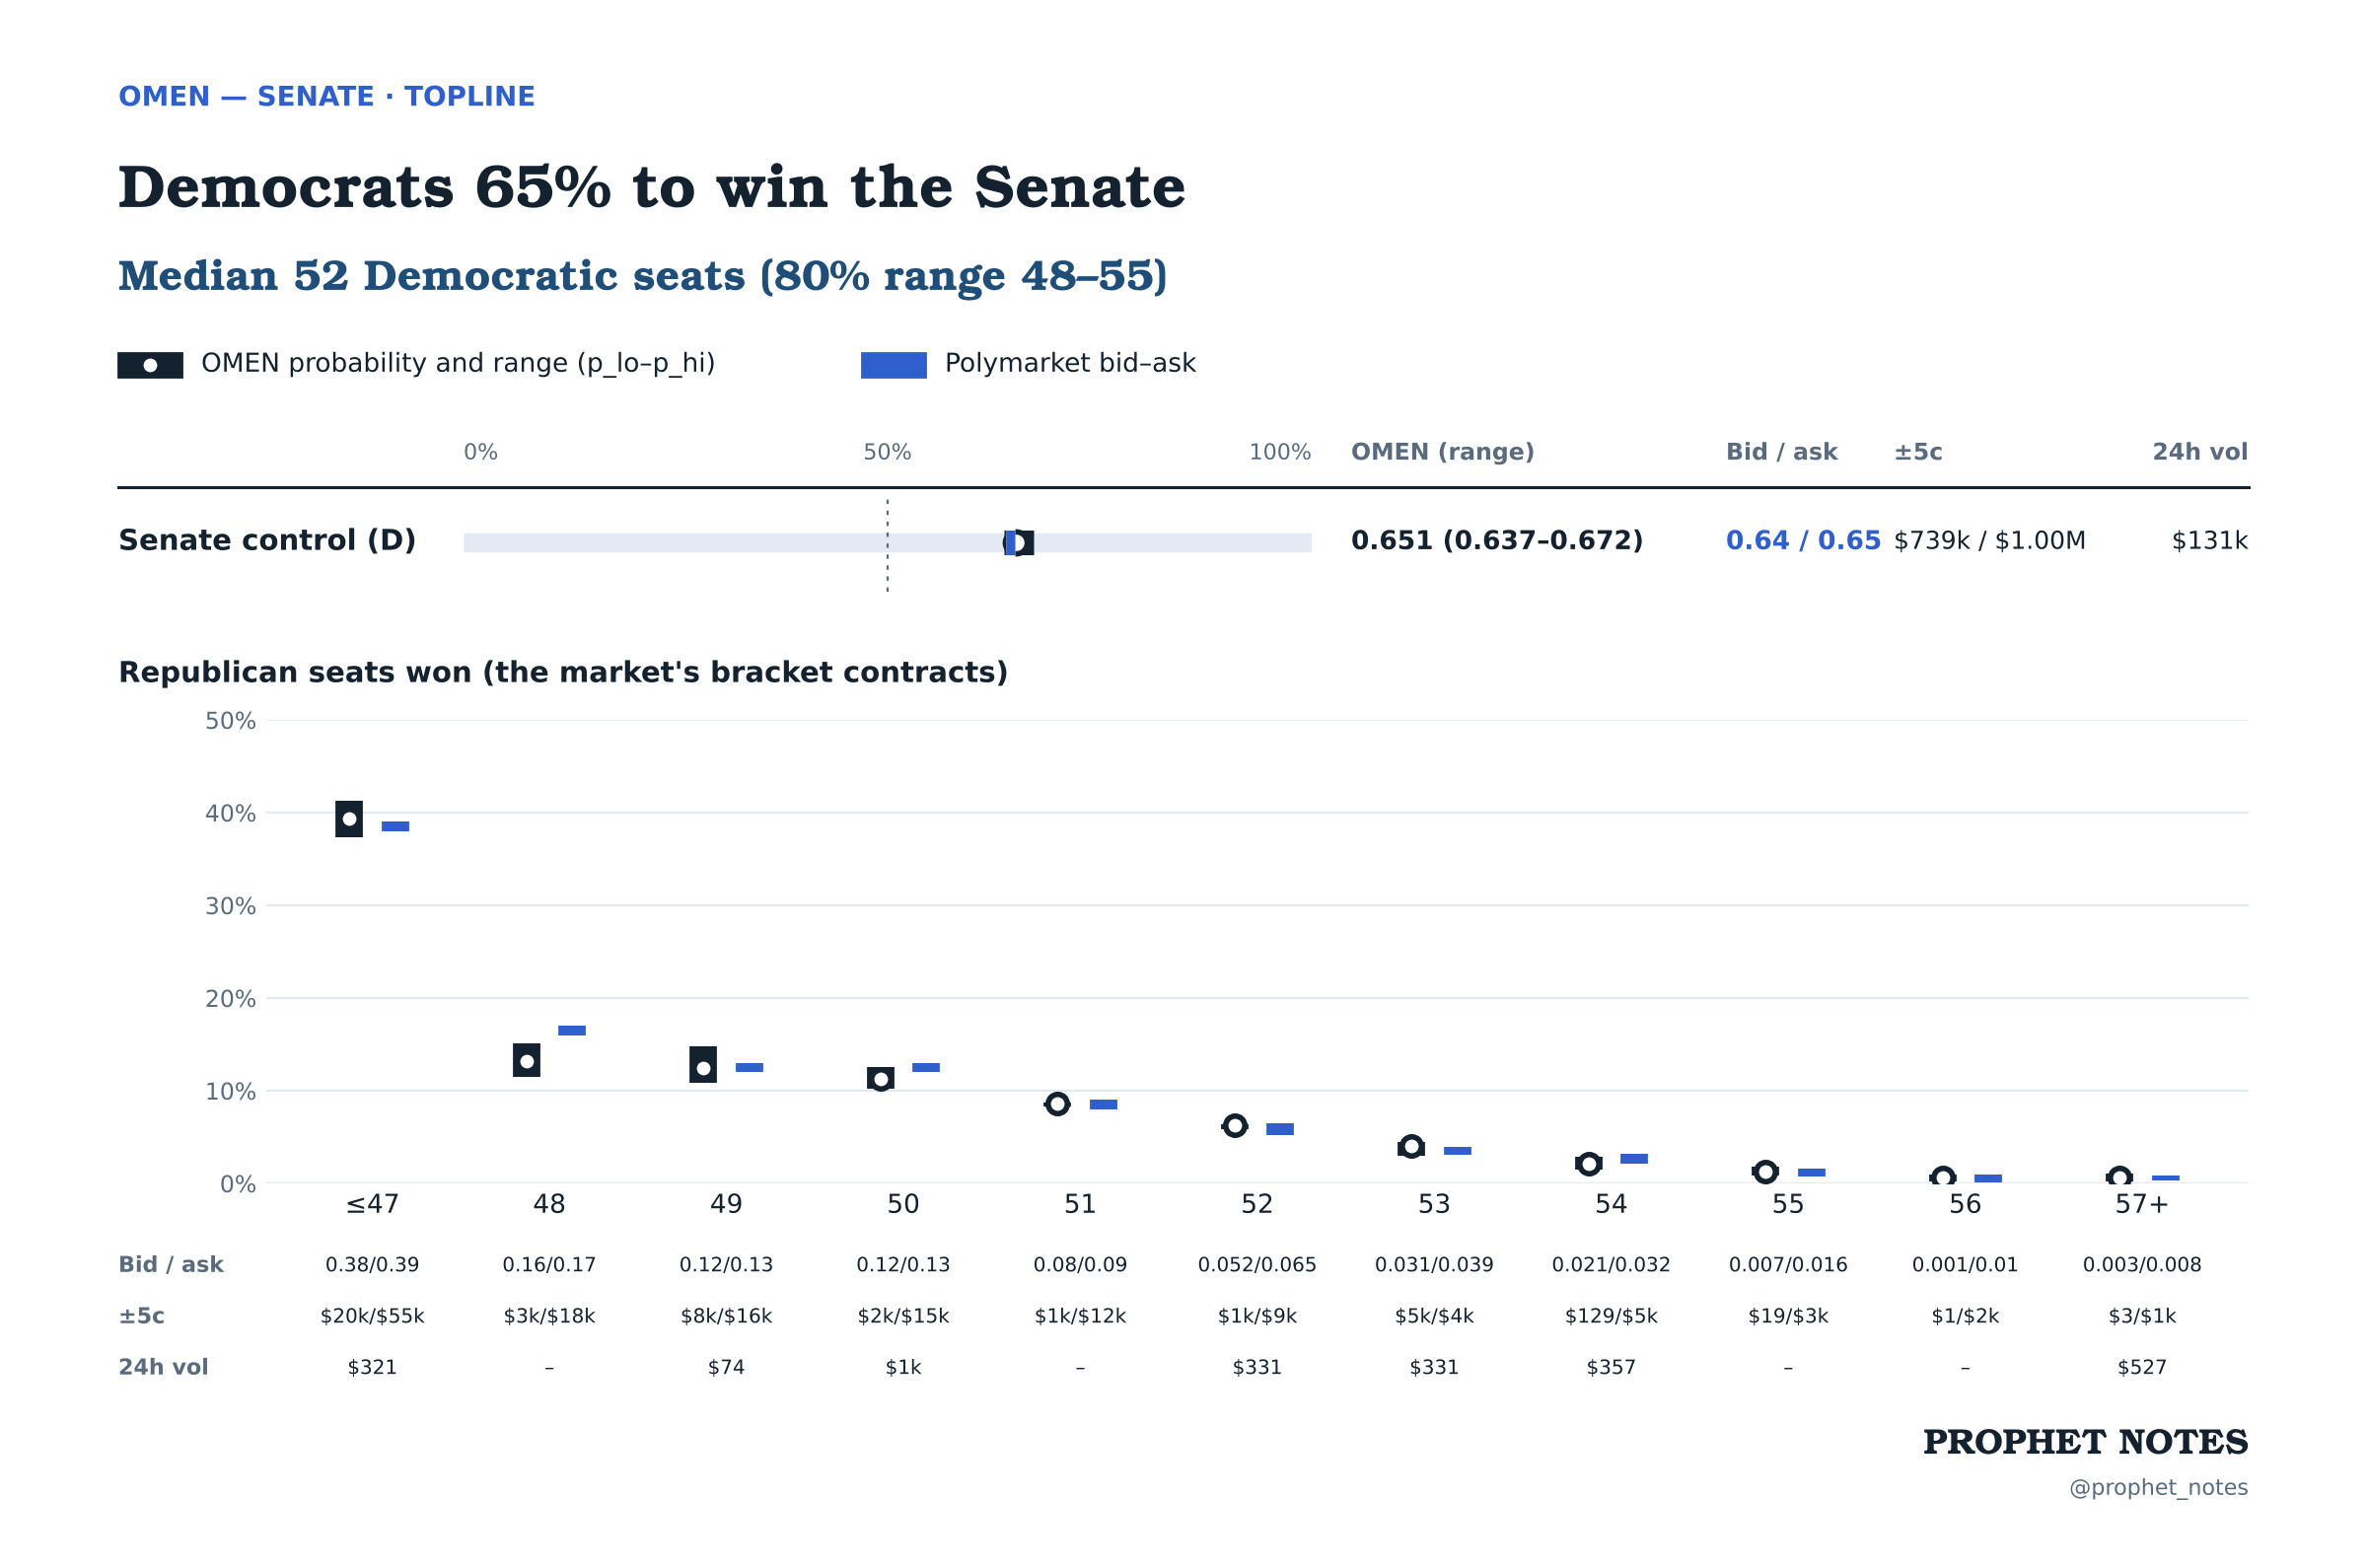
Both OMEN and I are bullish on Democrats. The topline is slightly above the market. The gap is clearer in the seat markets: I’m more bullish on Republicans winning fewer than 48 seats, and less bullish on exactly 48. Otherwise, you can see that the seat curve tracks the market.
I think that Democrats were dealt absolutely amazing cards this cycle. Global disruptions are putting pressure on prices in the very regions where Republicans are strongest. At the same time, Democrats have no coherent plan to actually use this advantage; no proper leader to chart the course. In fact, little has changed since the 2024 defeat.
While the national environment is propping Democrats up, they still face tough races in several states: Alaska, Iowa, Texas, Ohio, Maine, Kansas, Nebraska, Michigan. Later in this article, each gets its own segment with a forecast and overall race context.
House
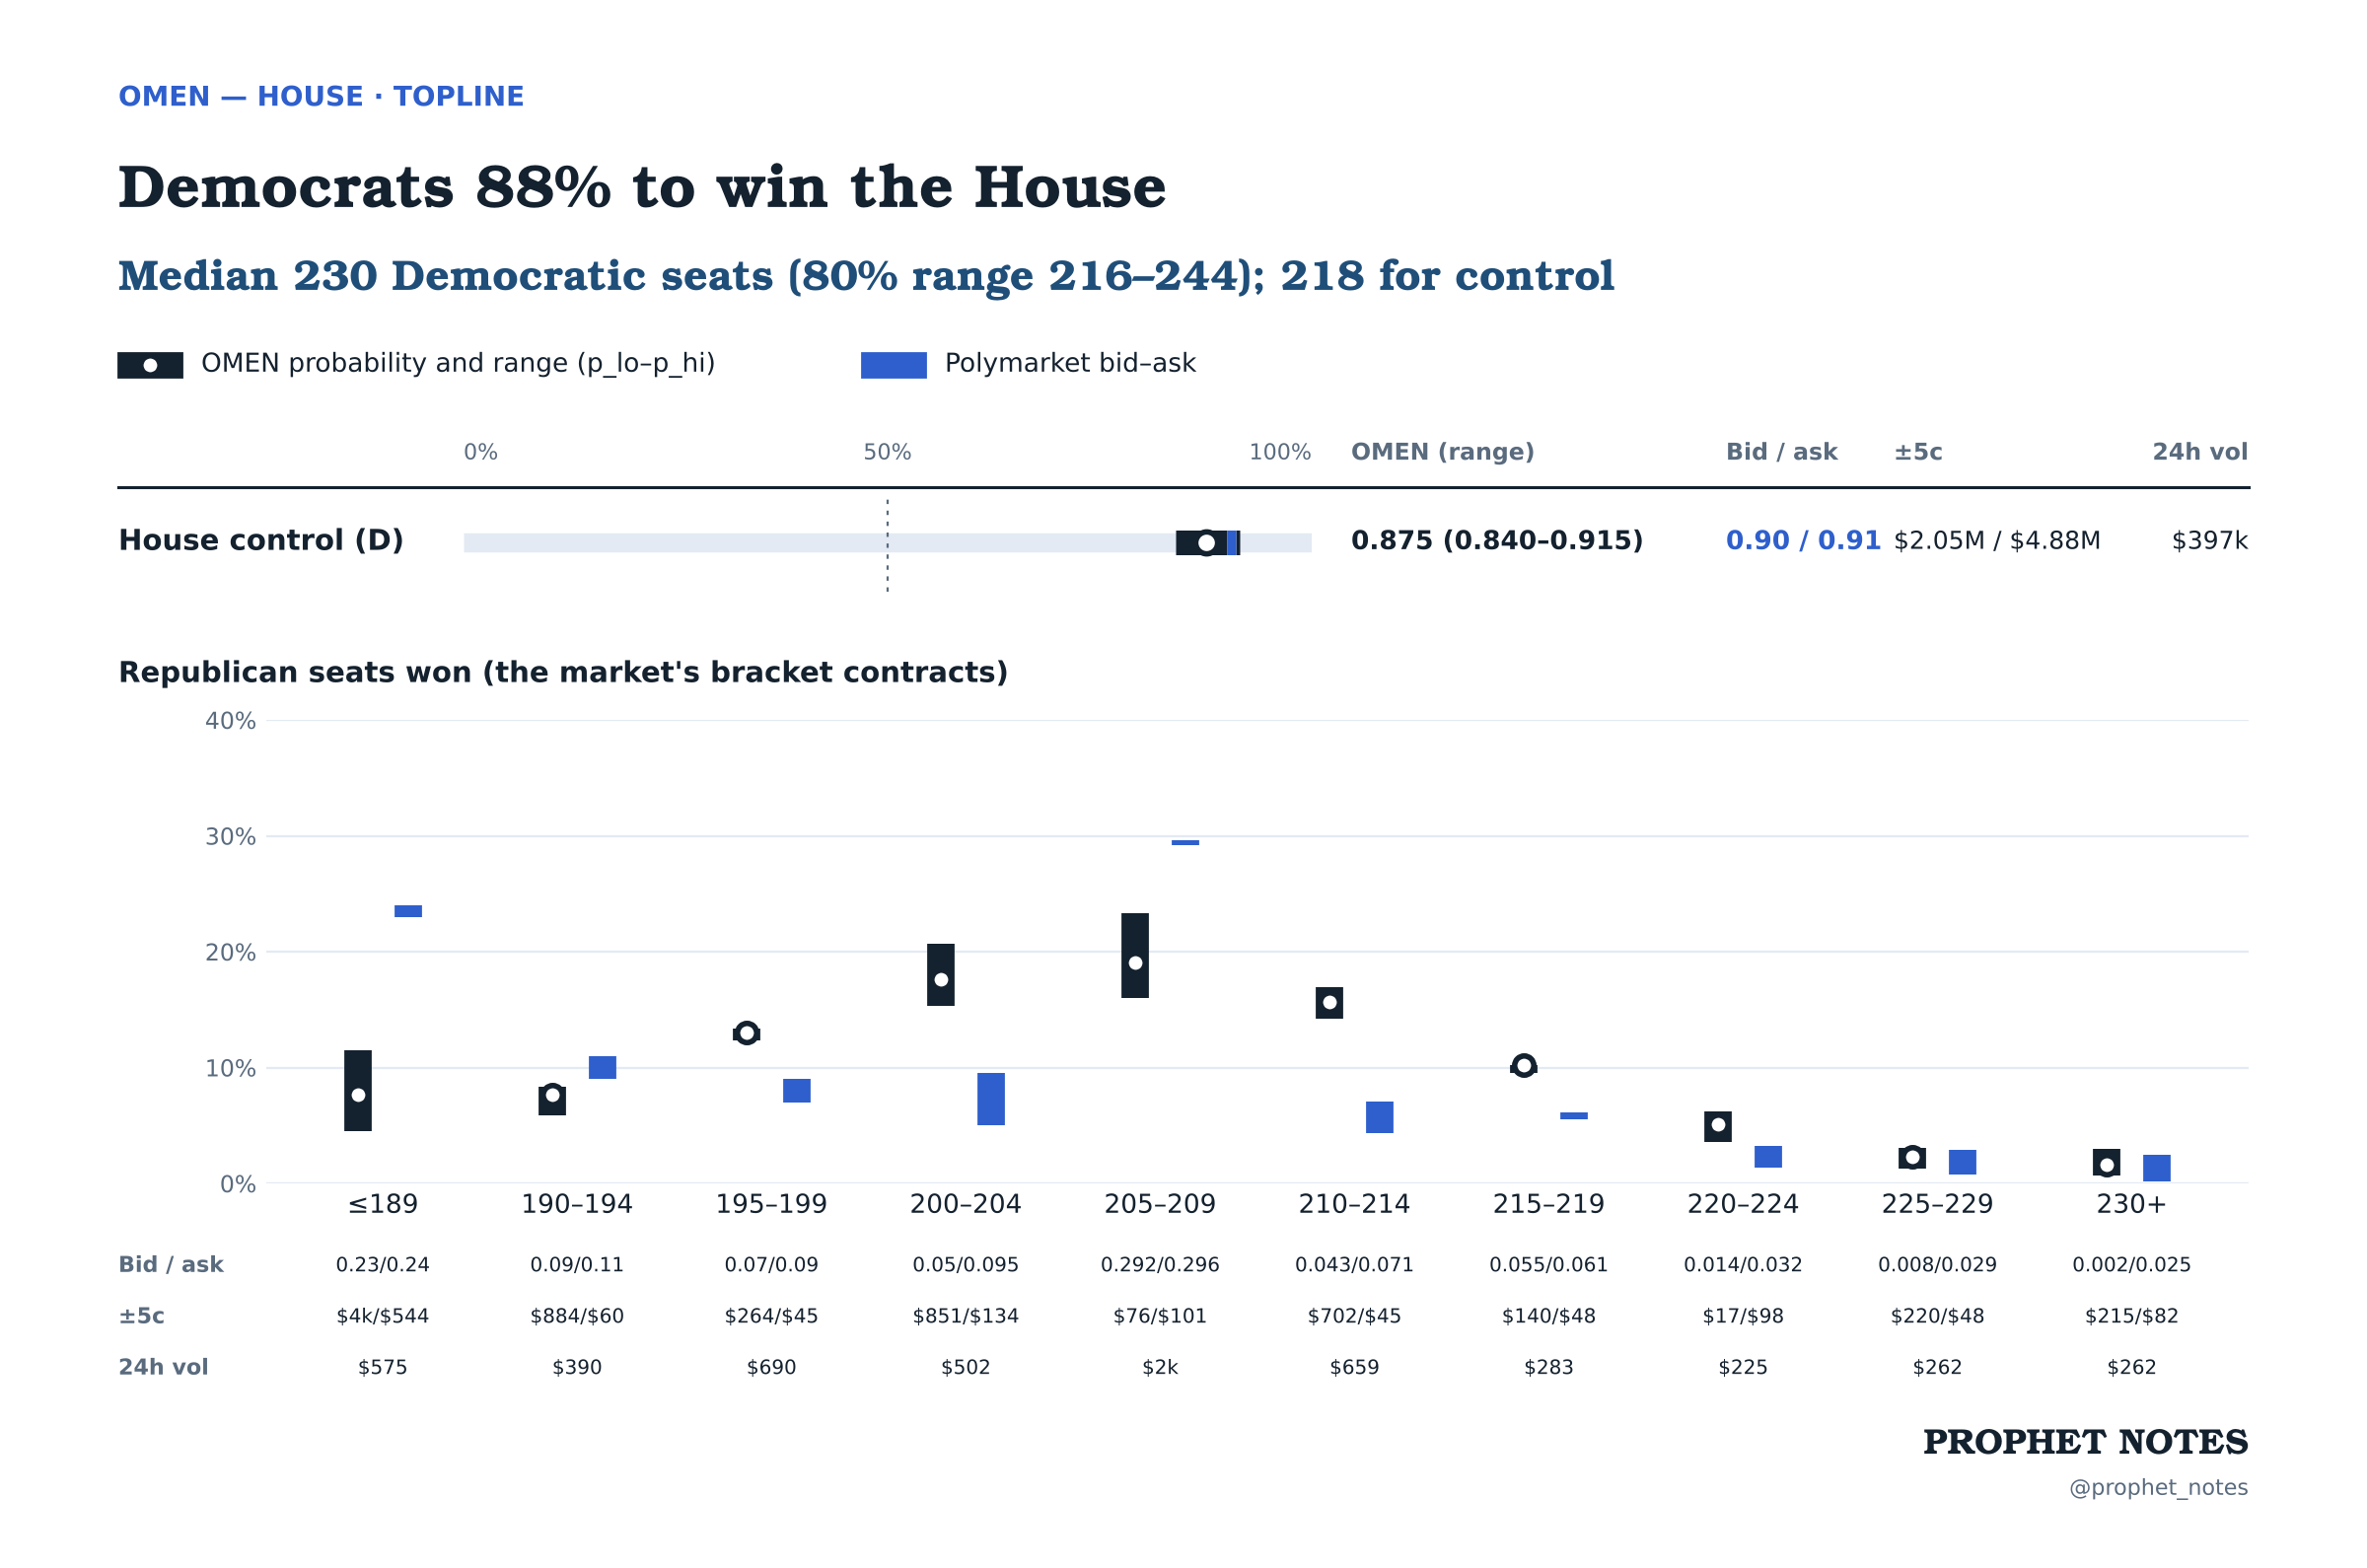
To my surprise, while OMEN is more bullish than the market on the Senate, it trails it on the House. The difference is once again minimal, but this time the seat brackets tell a different story. Mostly because the House seat book is almost empty; partly because OMEN really does differ from the consensus.
Unlike in the Senate, here I think OMEN has it right. Its seat curve is much smoother, closer to a real probability distribution. I also think a lot of traders treat a Dem House as a bond, which pushes the price slightly above fair.
One caveat: the House is far harder to model, because many races have no polls at all. That’s why its ranges are wider. And control will come down to a handful of races, which I cover below.
Governor
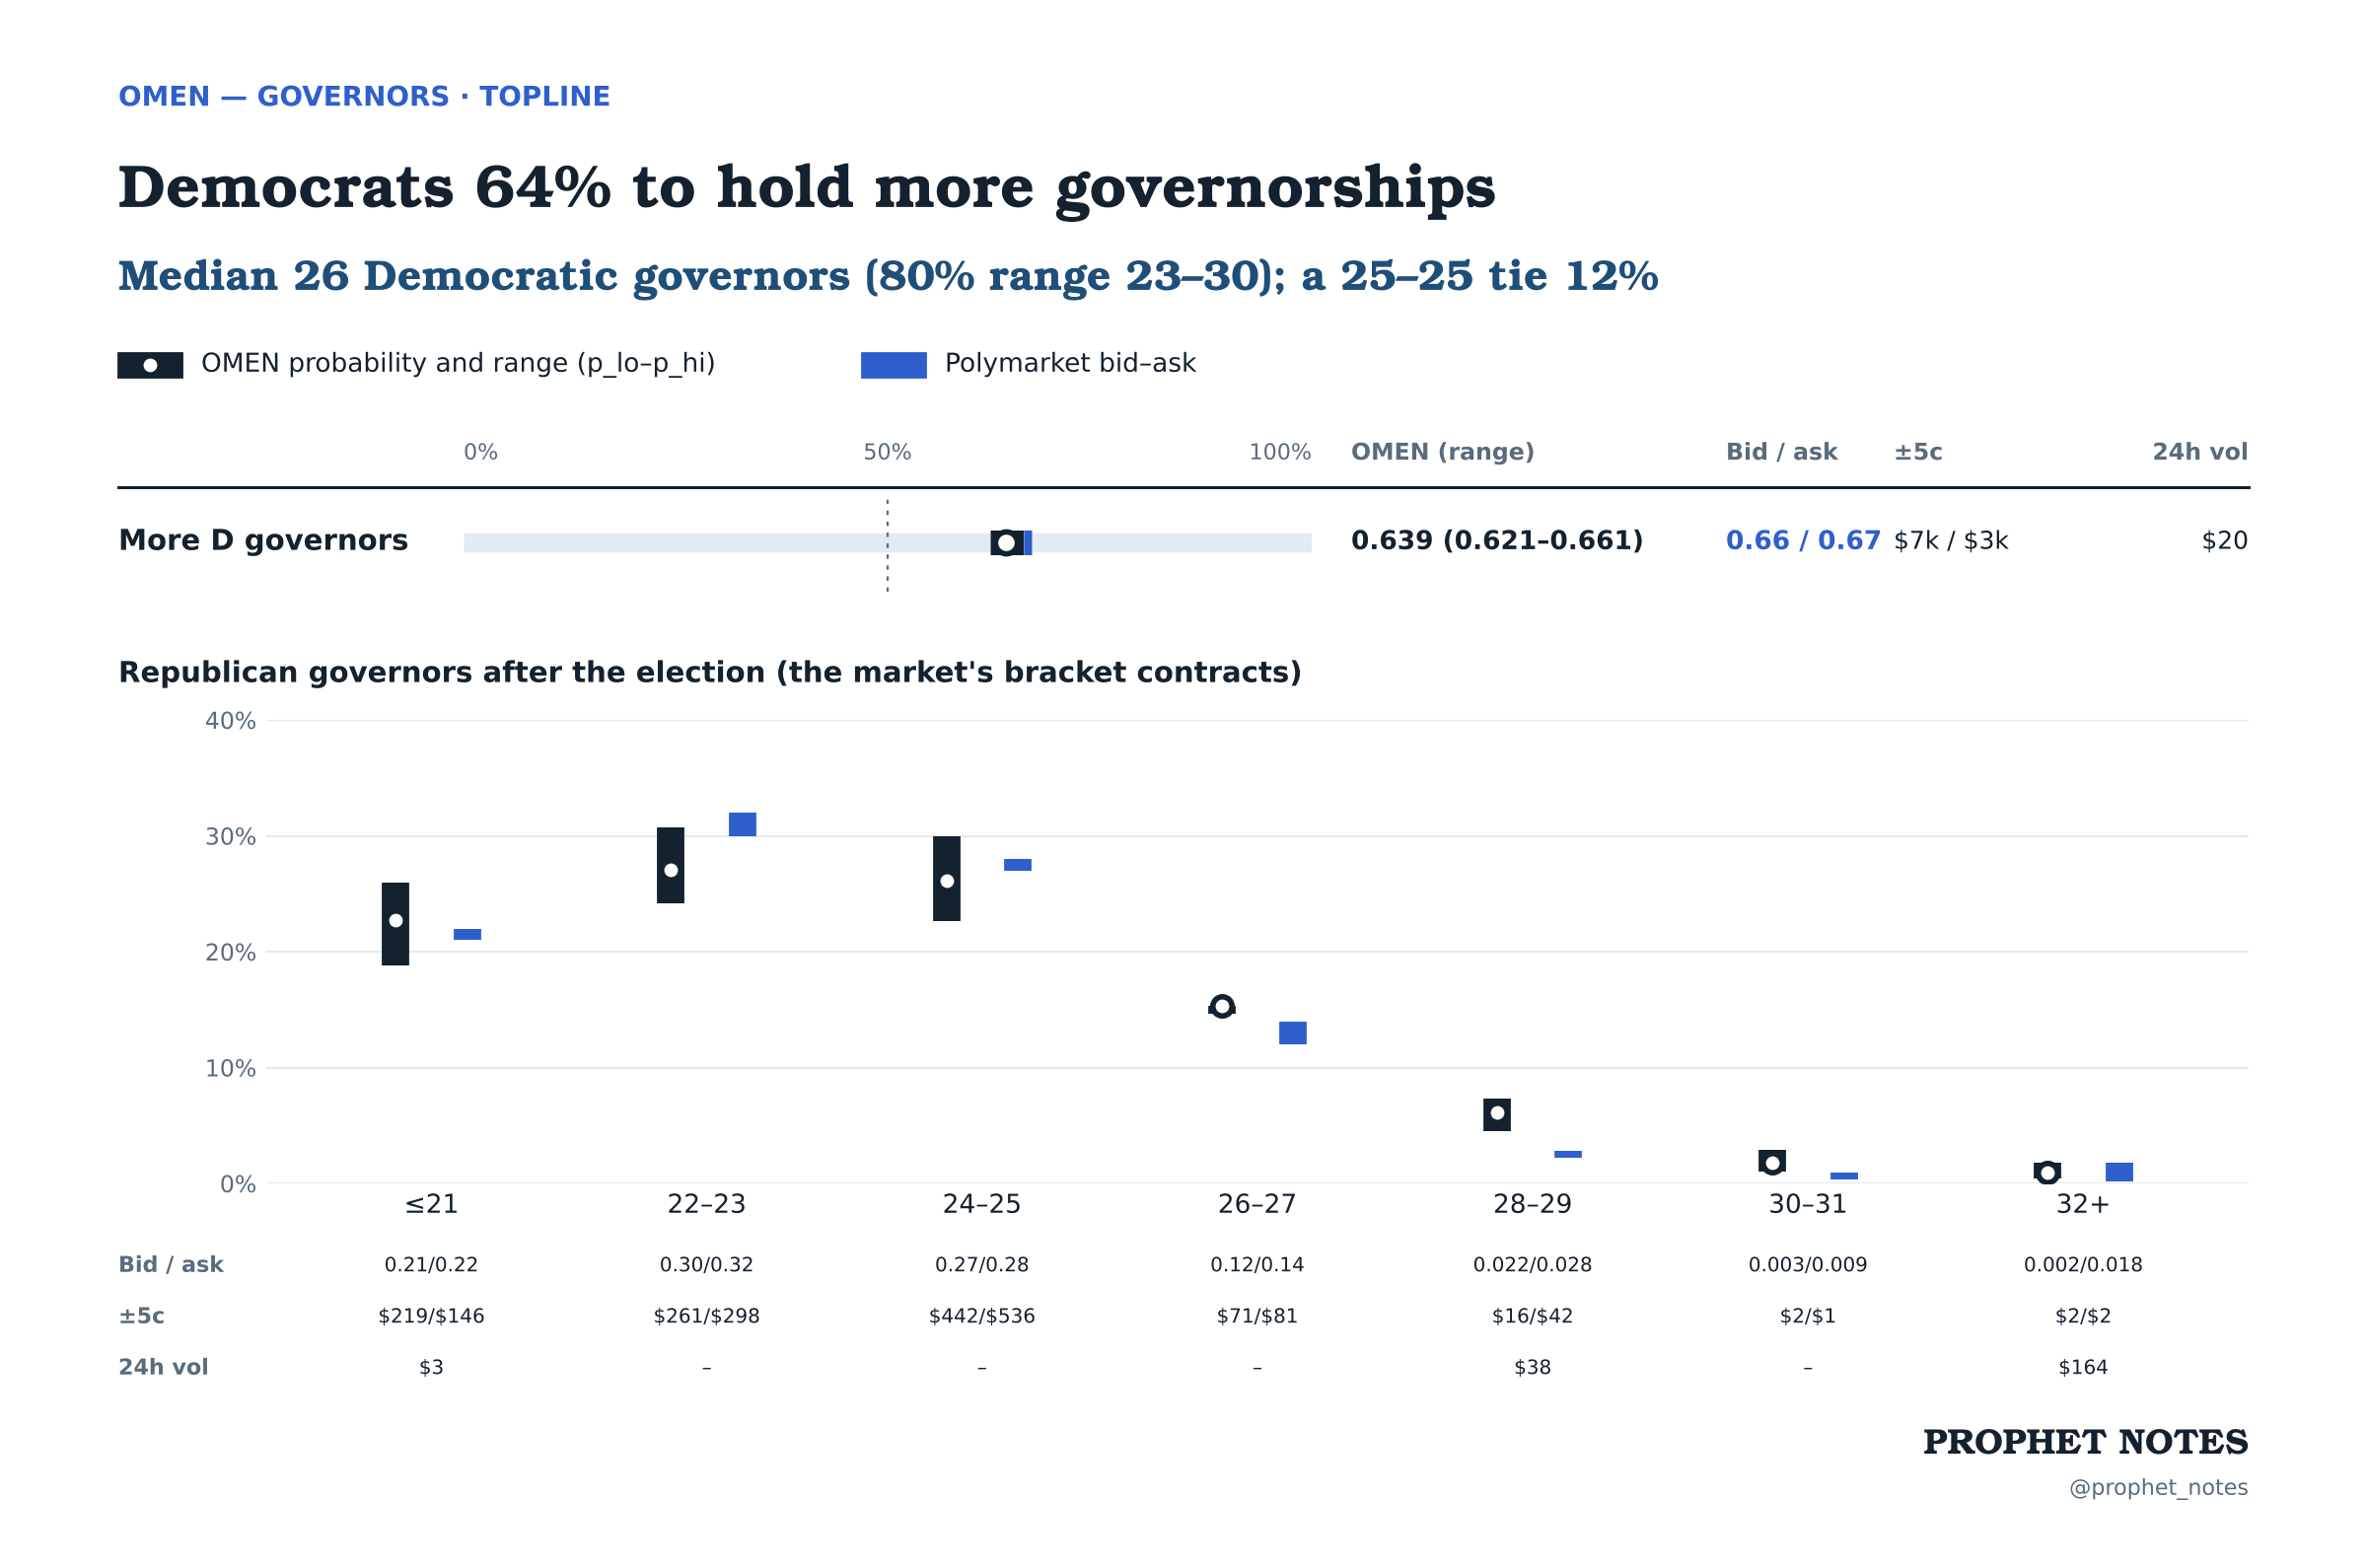
Governor races are the least surprising. Almost every topline, from control down to the exact number of governors, has the market price inside OMEN’s range.
Here, again, I’m bullish on Democrats. I’m not sure there’s a way not to be, with the generic ballot at D+9. Yet social media is full of people too lazy to look at the data, but never too lazy to run their mouths.
The governor landscape is a close copy of the Senate, with fewer flippable races: Georgia, Nevada, Ohio, Wisconsin.
Topline Remarks
One more detail on polls—I’m the last person to trust them blindly. Most of my election trading has gone against the market: Poland, the 2024 US election, Portugal, and recently Brazil. Based on these alone, you could even say I’m biased towards the right.
But in each of these cases, a big trend favored the underdog. If I hand-adjusted anything on the topline, it would be the generic ballot—even more bullish on Democrats.
Deeper
The fun part starts when we look at individual races. Here, OMEN sometimes significantly differs from the market. Even more interesting, it doesn’t lean one way across the board: in some races it’s more bullish on Democrats than the market, in others on Republicans. That’s a sign of a good fit—it’s easy to build a model that leans to one side, much harder to build a balanced one.
This section is today’s snapshot with context. As news comes in, I’ll share regular (maybe daily?) OMEN updates, with commentary on the races that move most.
This part is for my paid subscribers, but there’s one race I simply need to show before the paywall.
Senate
Alaska
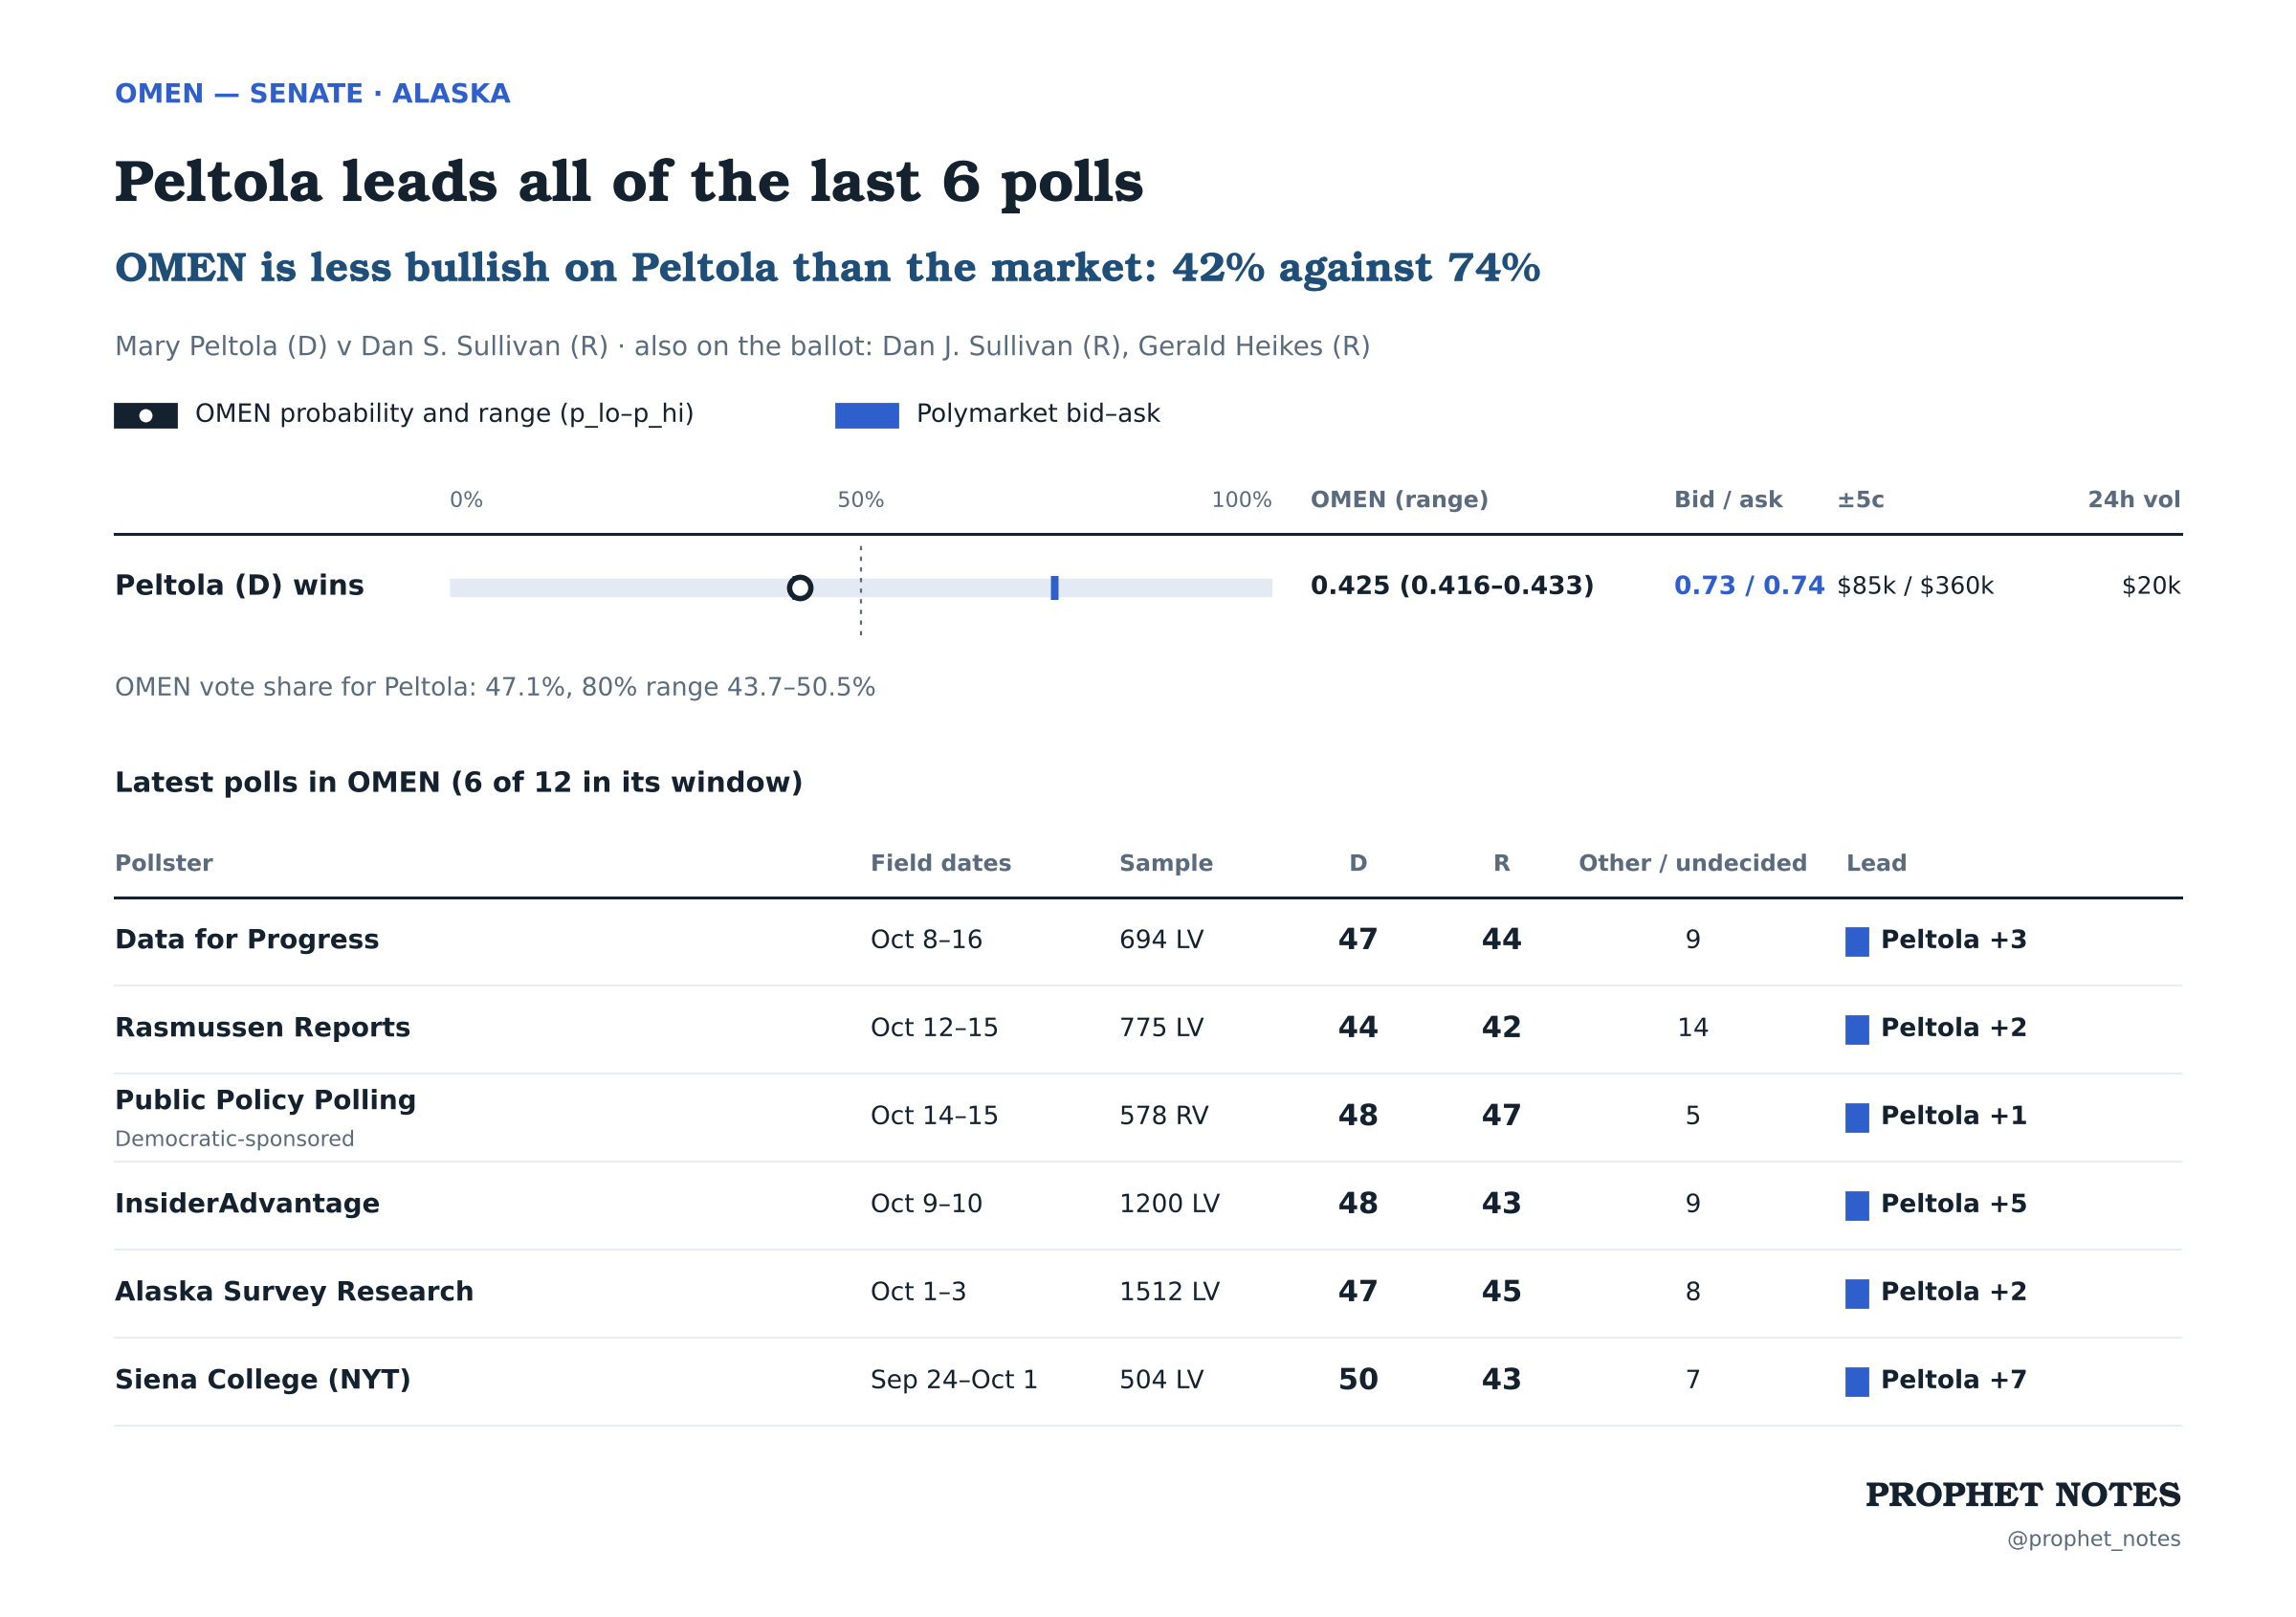
I am bullish on Democrats taking the Senate. Yet I can’t agree with the market on Alaska. Peltola leads every recent poll, but only by 1 to 7 points. No poll has her above 50%, which hurts her in ranked-choice counting.
Yes, Sullivan did poorly at the debates. But Alaska is a deeply red state, and Sullivan is an incumbent (yes, it does work in his favor). Ranked-choice voting helps him too, because every other candidate on the ballot is a Republican. His namesake will take a small share of votes meant for him, and most of those will flow back to the ‘correct’ Sullivan in later rounds. The transfer assumptions you need to get Peltola to the market’s 0.73/0.74 are simply unrealistic.
Her chances ride on the national environment, and OMEN accounts for that. She is almost tied for a Senate seat in a state that Trump won by 13.1 points in 2024. She lost her House seat in that election, but only by 2.4 points. The model recognizes that. However, it weighs it against Alaska’s lean and history, Sullivan’s incumbency and other factors. Ultimately, it sees a toss-up. While it’s bearish vs other public forecasts, I consider it bullish—Republicans were almost 80% favorites to win Alaska a year ago!
That being said, I’m positioned against Peltola. Partly because it’s a great +EV position, and partly because it hedges a systematic poll miss against my otherwise Dem-leaning book.